Standard residuals use one stream. Hyper-Connections use n parallel streams with learnable mixing matrices (H_res). Full explanation →
Amax Counter
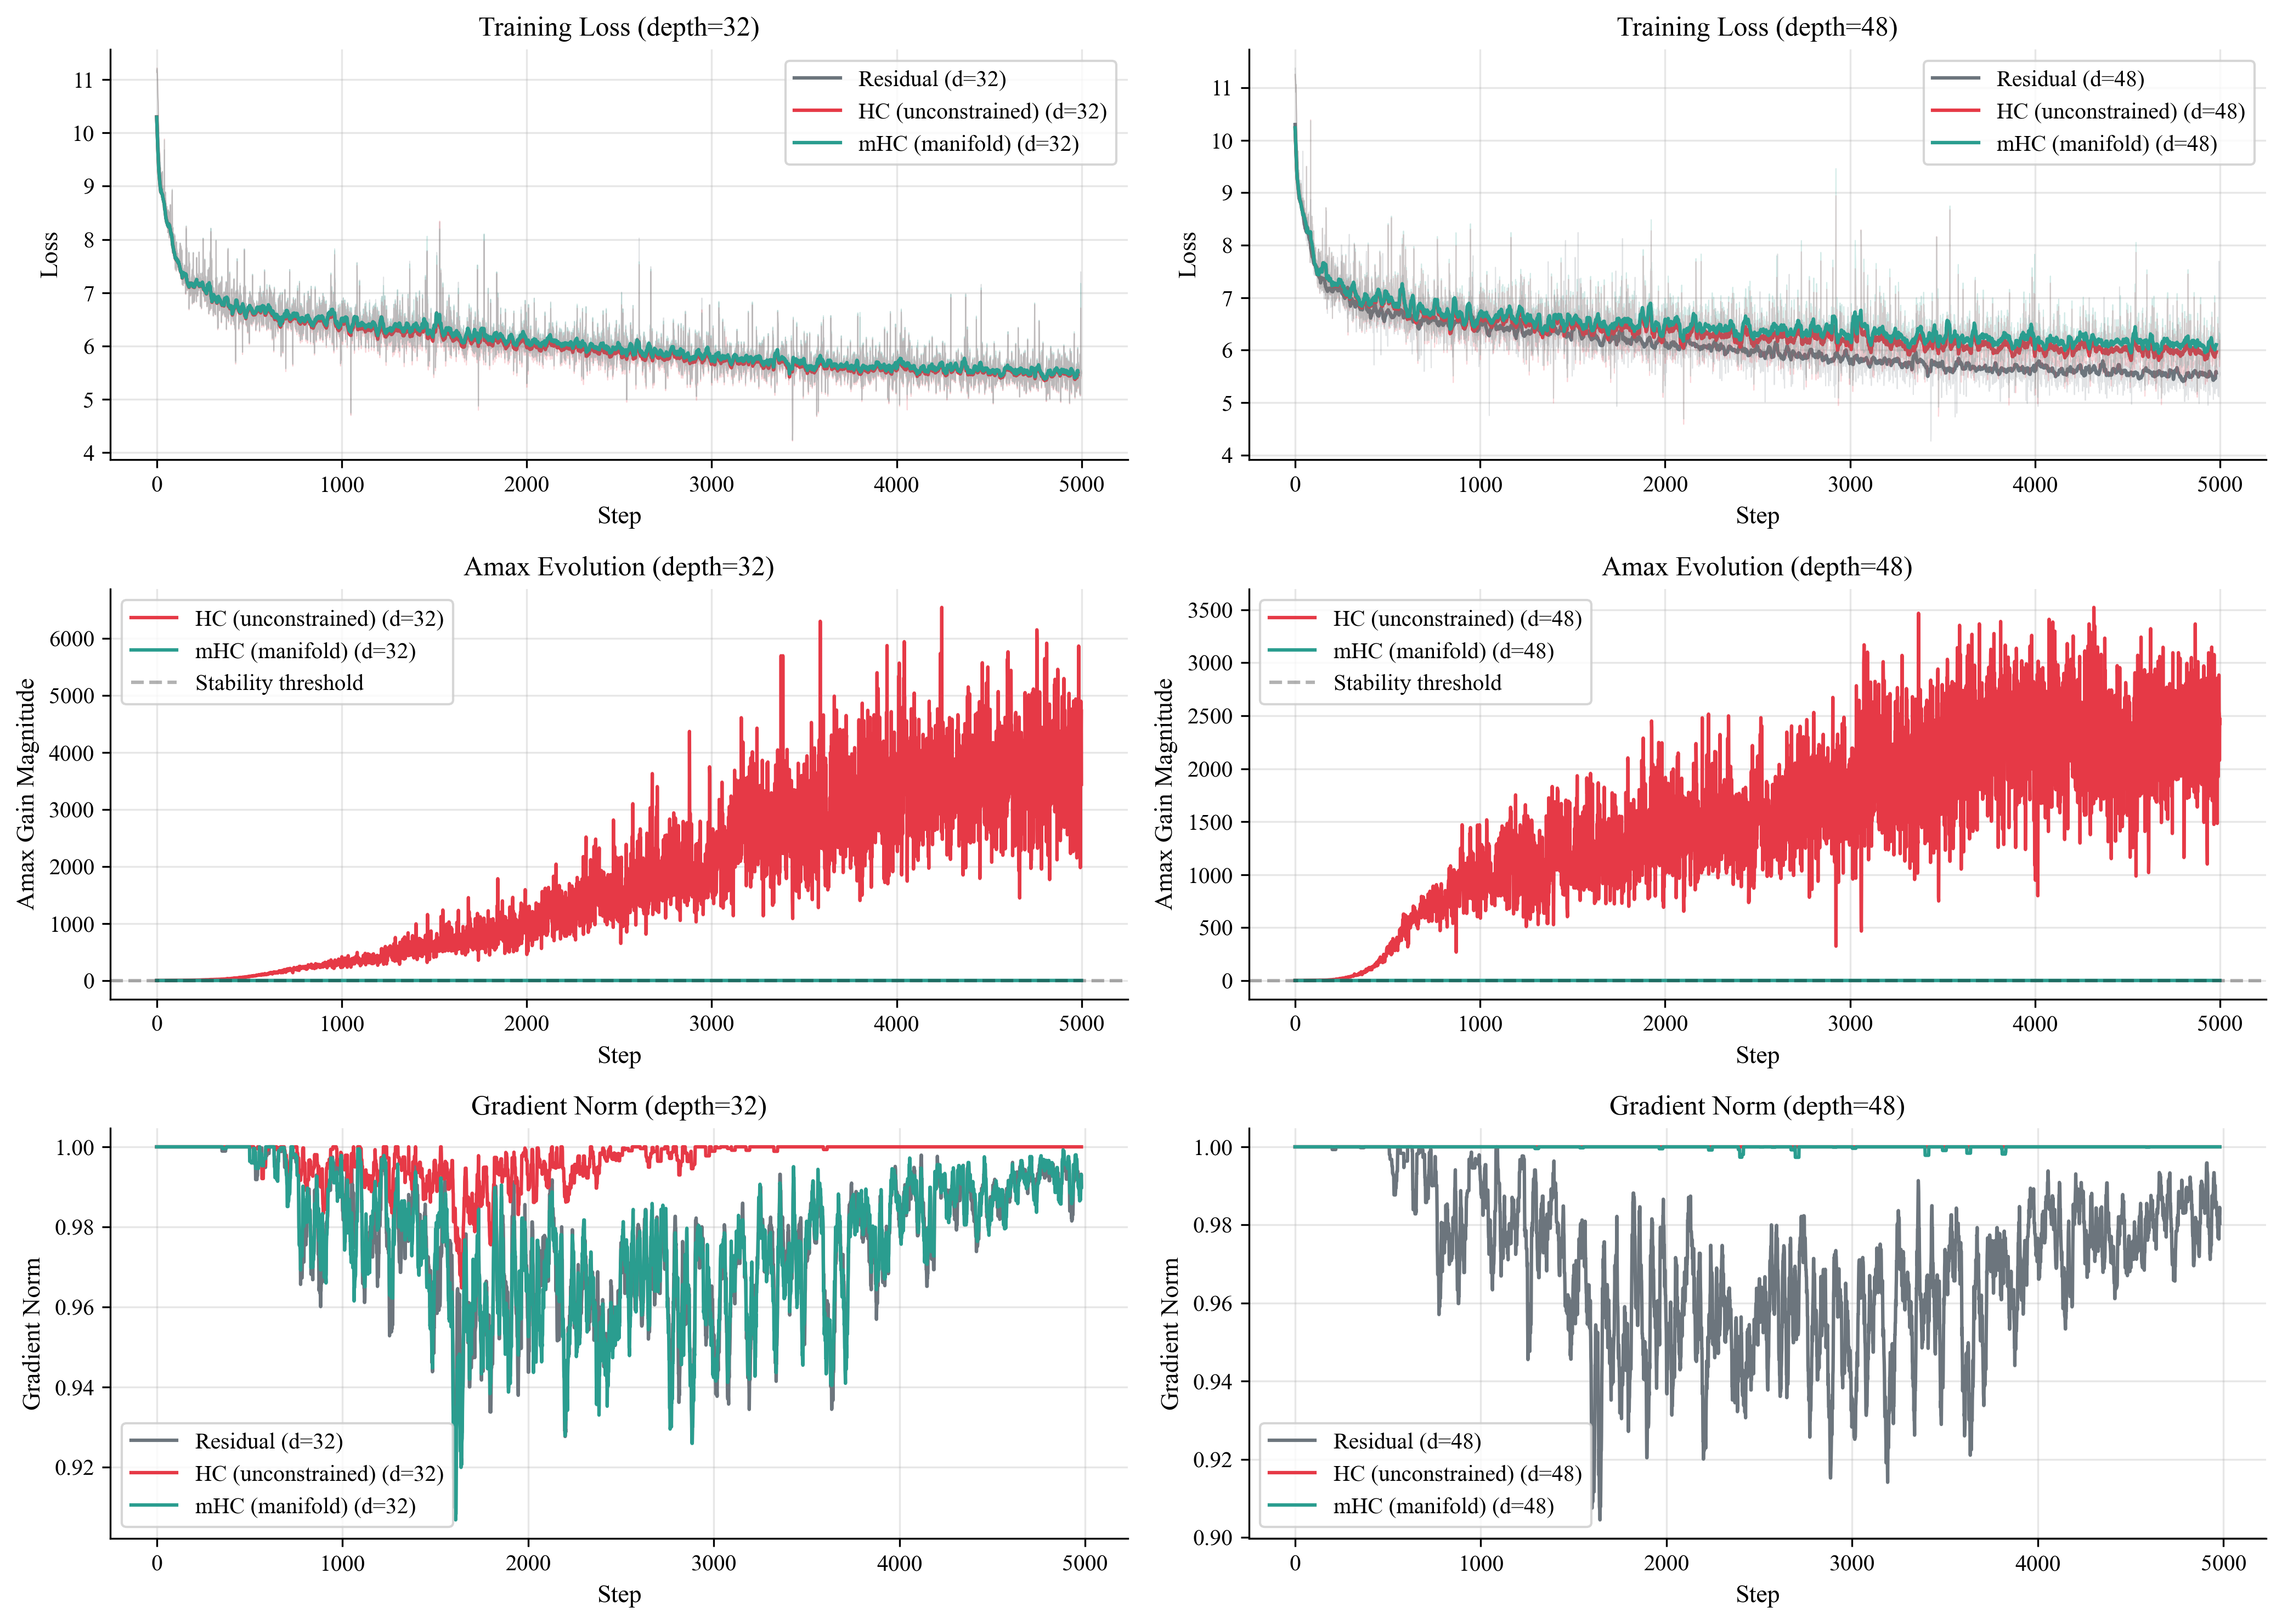
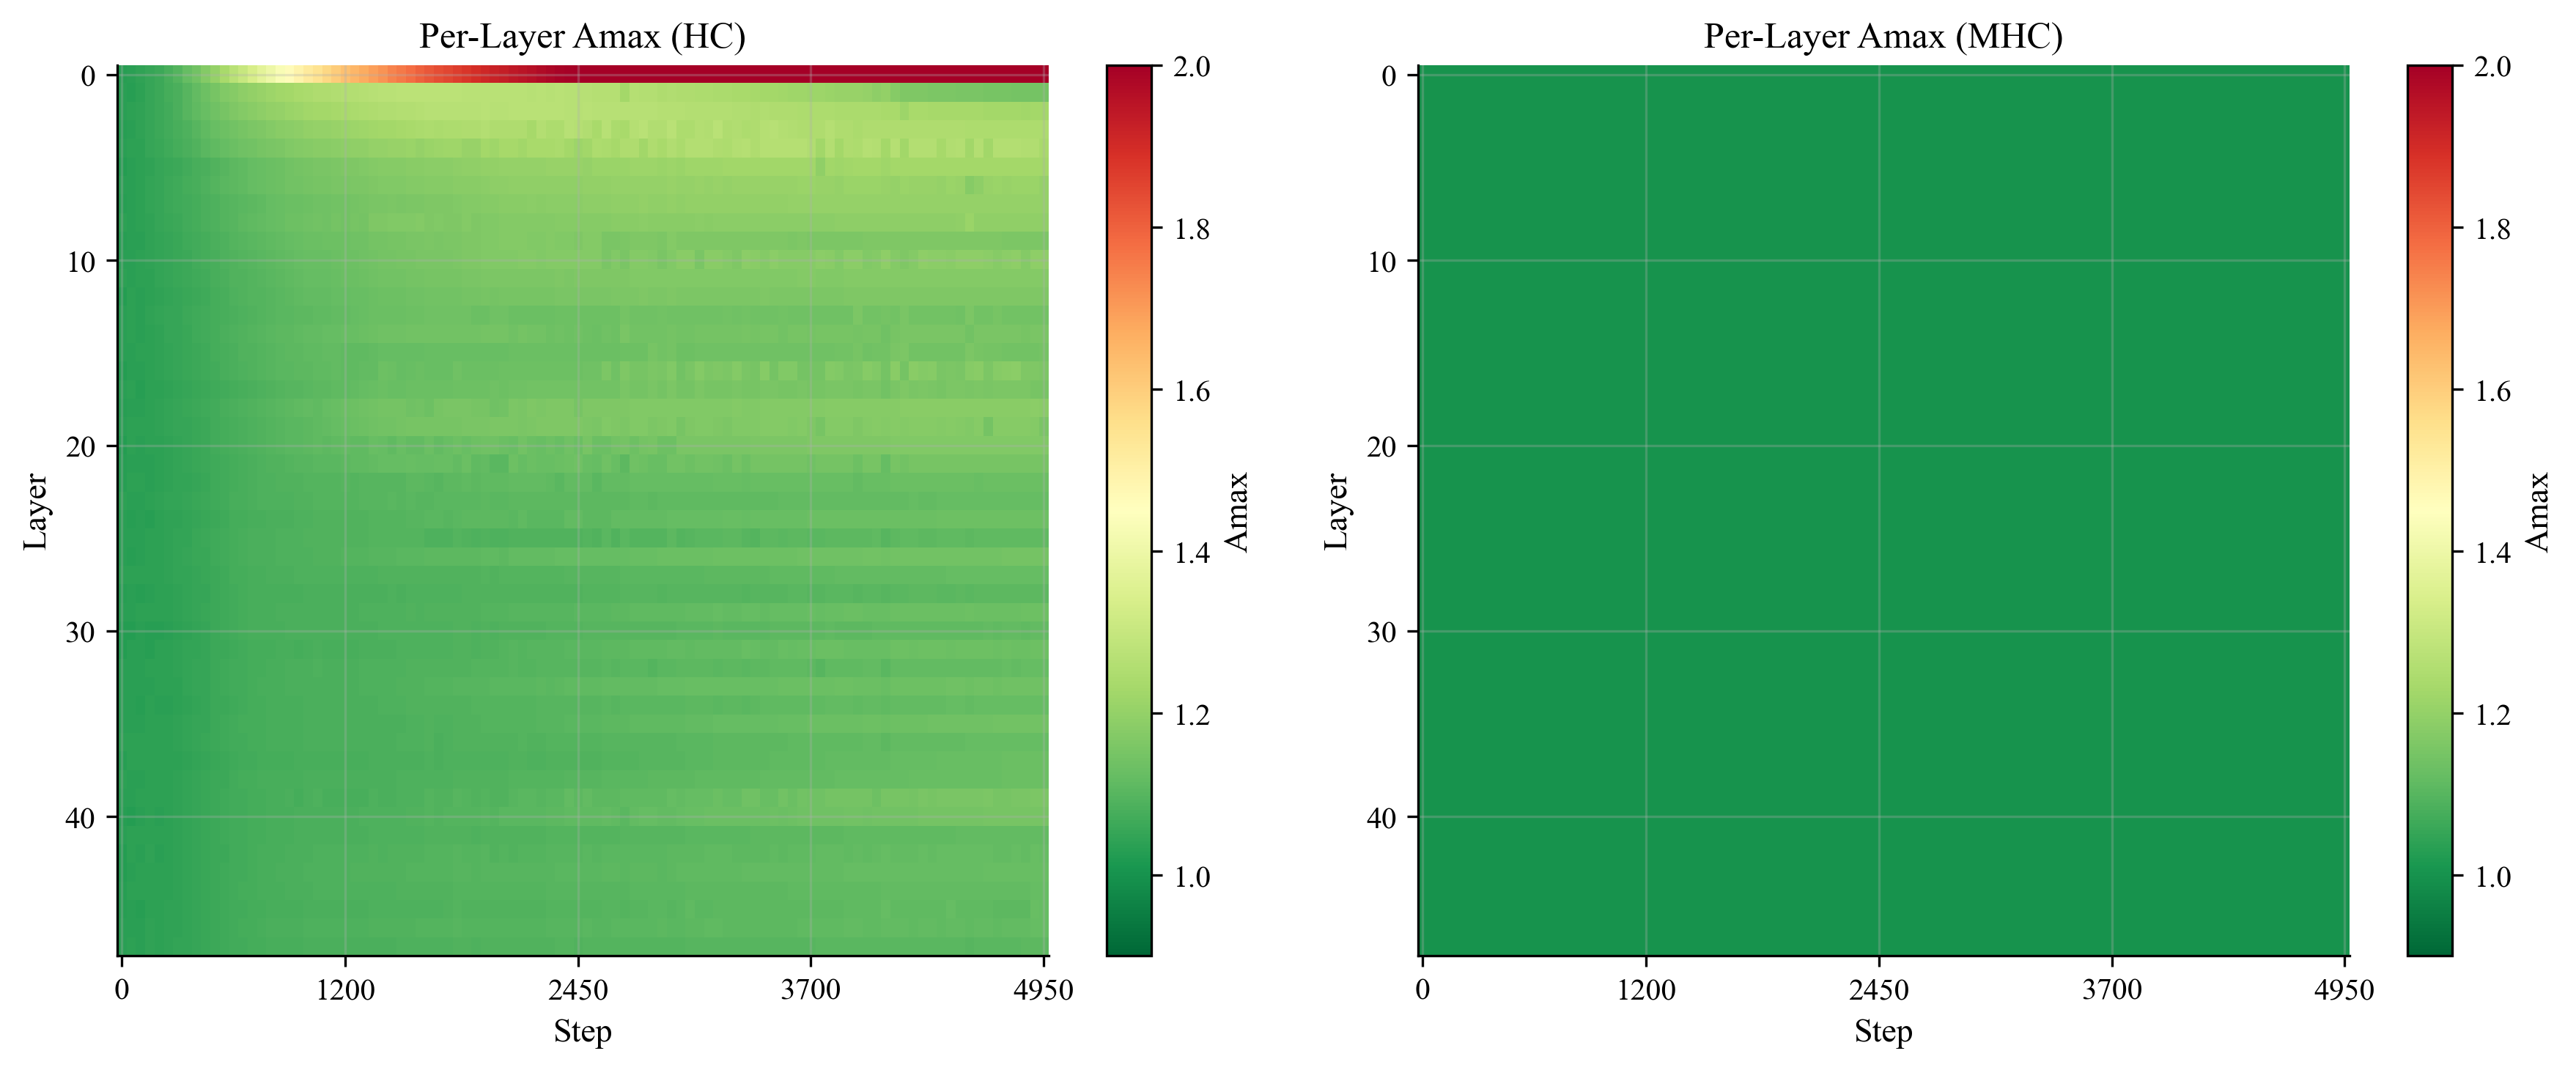
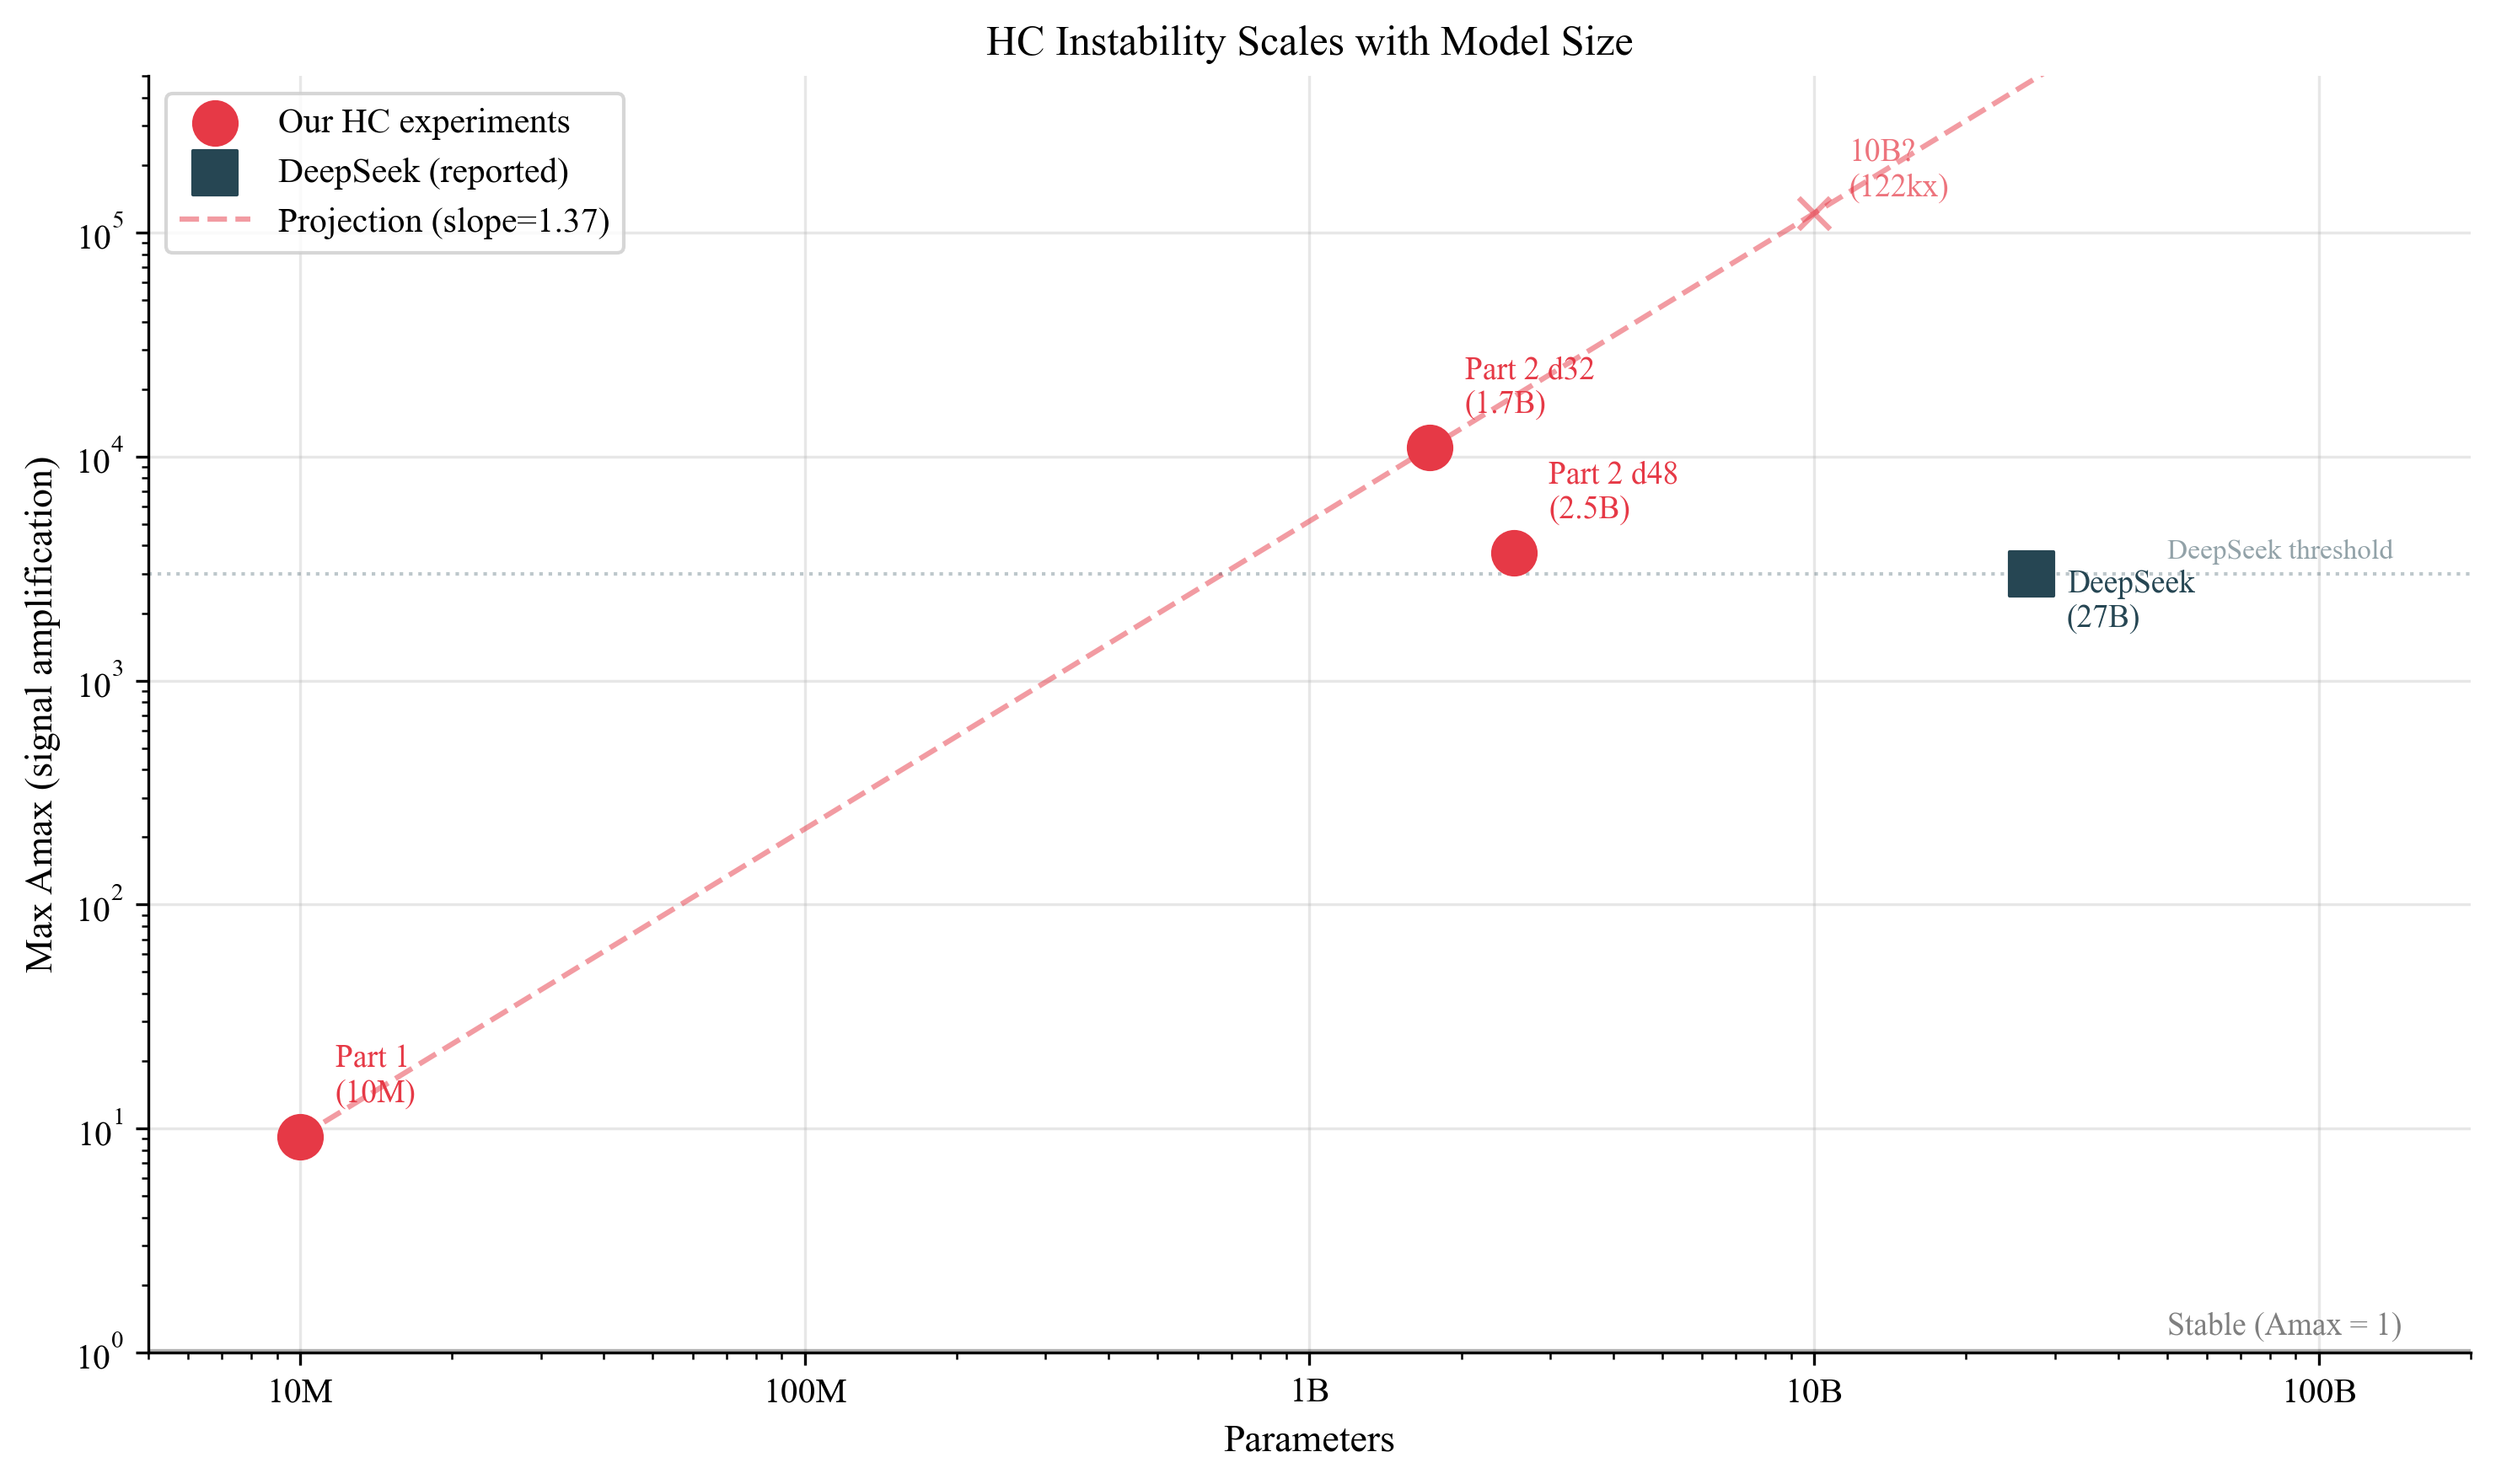
HC hits 10,924x signal amplification at 1.7B parameters. mHC stays at 1.0. Full explanation →
HC
1.00
starting
mHC
1.00
stable
Step: 0 / 5,000
Layer Heatmap
Instability starts at Layer 0, the input embedding. Not a deep network problem. Full explanation →
HC
mHC
1.0 1.5 2.0+
Step: 0 / 5,000
Sinkhorn-Knopp
Alternating row/column normalization converges to doubly stochastic. The fix. Details →
Converged
Iteration 5/5
Charts
Same Median, Two Answers
At an identical 2-second median reward time, GPU idle is 7.5% or 55.0%, depending only on whether one completion out of 128 hit the timeout. GRPO waits on the slowest. Full explanation →
Identical median reward time, 7.3x difference in idle. GRPO waits on the slowest completion in the batch, so one timeout out of 128 sets the whole step. Idle is bimodal, and the mean of the two describes a state that never occurs.
Idle Against Reward Service Time
Measured on one L4 with generation held fixed to 0.18% across the ladder. The shaded region is unreachable: a real per-completion sandbox has a 1.37 s floor. Full explanation →
GPU idle against reward service time. 10 steps per rung, generation held fixed to 0.18% across the ladder. The shaded region is unreachable: a per-completion Modal sandbox measured a 1.37 s floor for a payload that does nothing.
Why Cutting the Timeout Rate Fails
At 128 completions per barrier, a 2%, 5% or 10% timeout rate all give near-certainty of paying the full timeout. Batch size sets where the knee is. Full explanation →
Derived from the binomial, not measured. At N=128 a 2%, 5% or 10% timeout rate all give near-certainty, which is why cutting the rate buys nothing. Smaller batches lower the odds and raise the cost per completion, so the fixes that move the barrier are a lower timeout constant and a finer-grained barrier.